
This summer I spent my time as an Experiential Fellow with the Center for Digital Scholarship cleaning and organizing James Madison’s meteorological dataset for the Historic Meteorological Records Project. Over the course of these couple months, I realized how much effort goes into the decision-making process to create open historic data. One of the takeaways from this project has been that transparency and documentation are necessary for open-sourced resources. Little did I know that decisions about how to display and record Madison’s data could directly impact researchers’ interpretations. This post will briefly discuss some examples of this decision process throughout the project.
As a digital humanist and academic, I have known for a long time that data can aim to be unbiased, but rarely does it ever accomplish that goal. There are parameters, exceptions, and ways to read data that makes the process of making and using a dataset more complicated than it initially seems. For example, the Madison weather data was initially transcribed and arranged by Daniel Druckenbrod; I first needed to understand his process before I transitioned that data to a new spreadsheet.. How did he choose what to transcribe and then how to structure it?
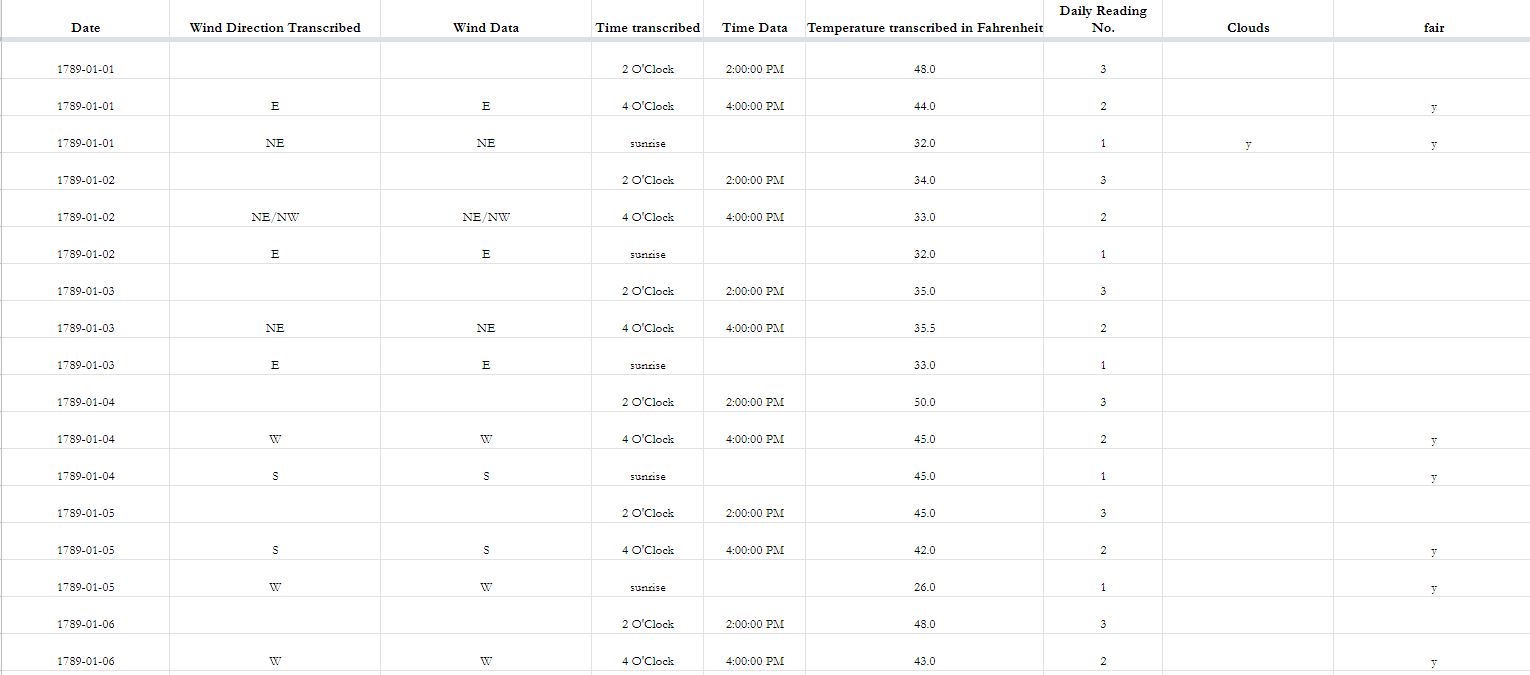
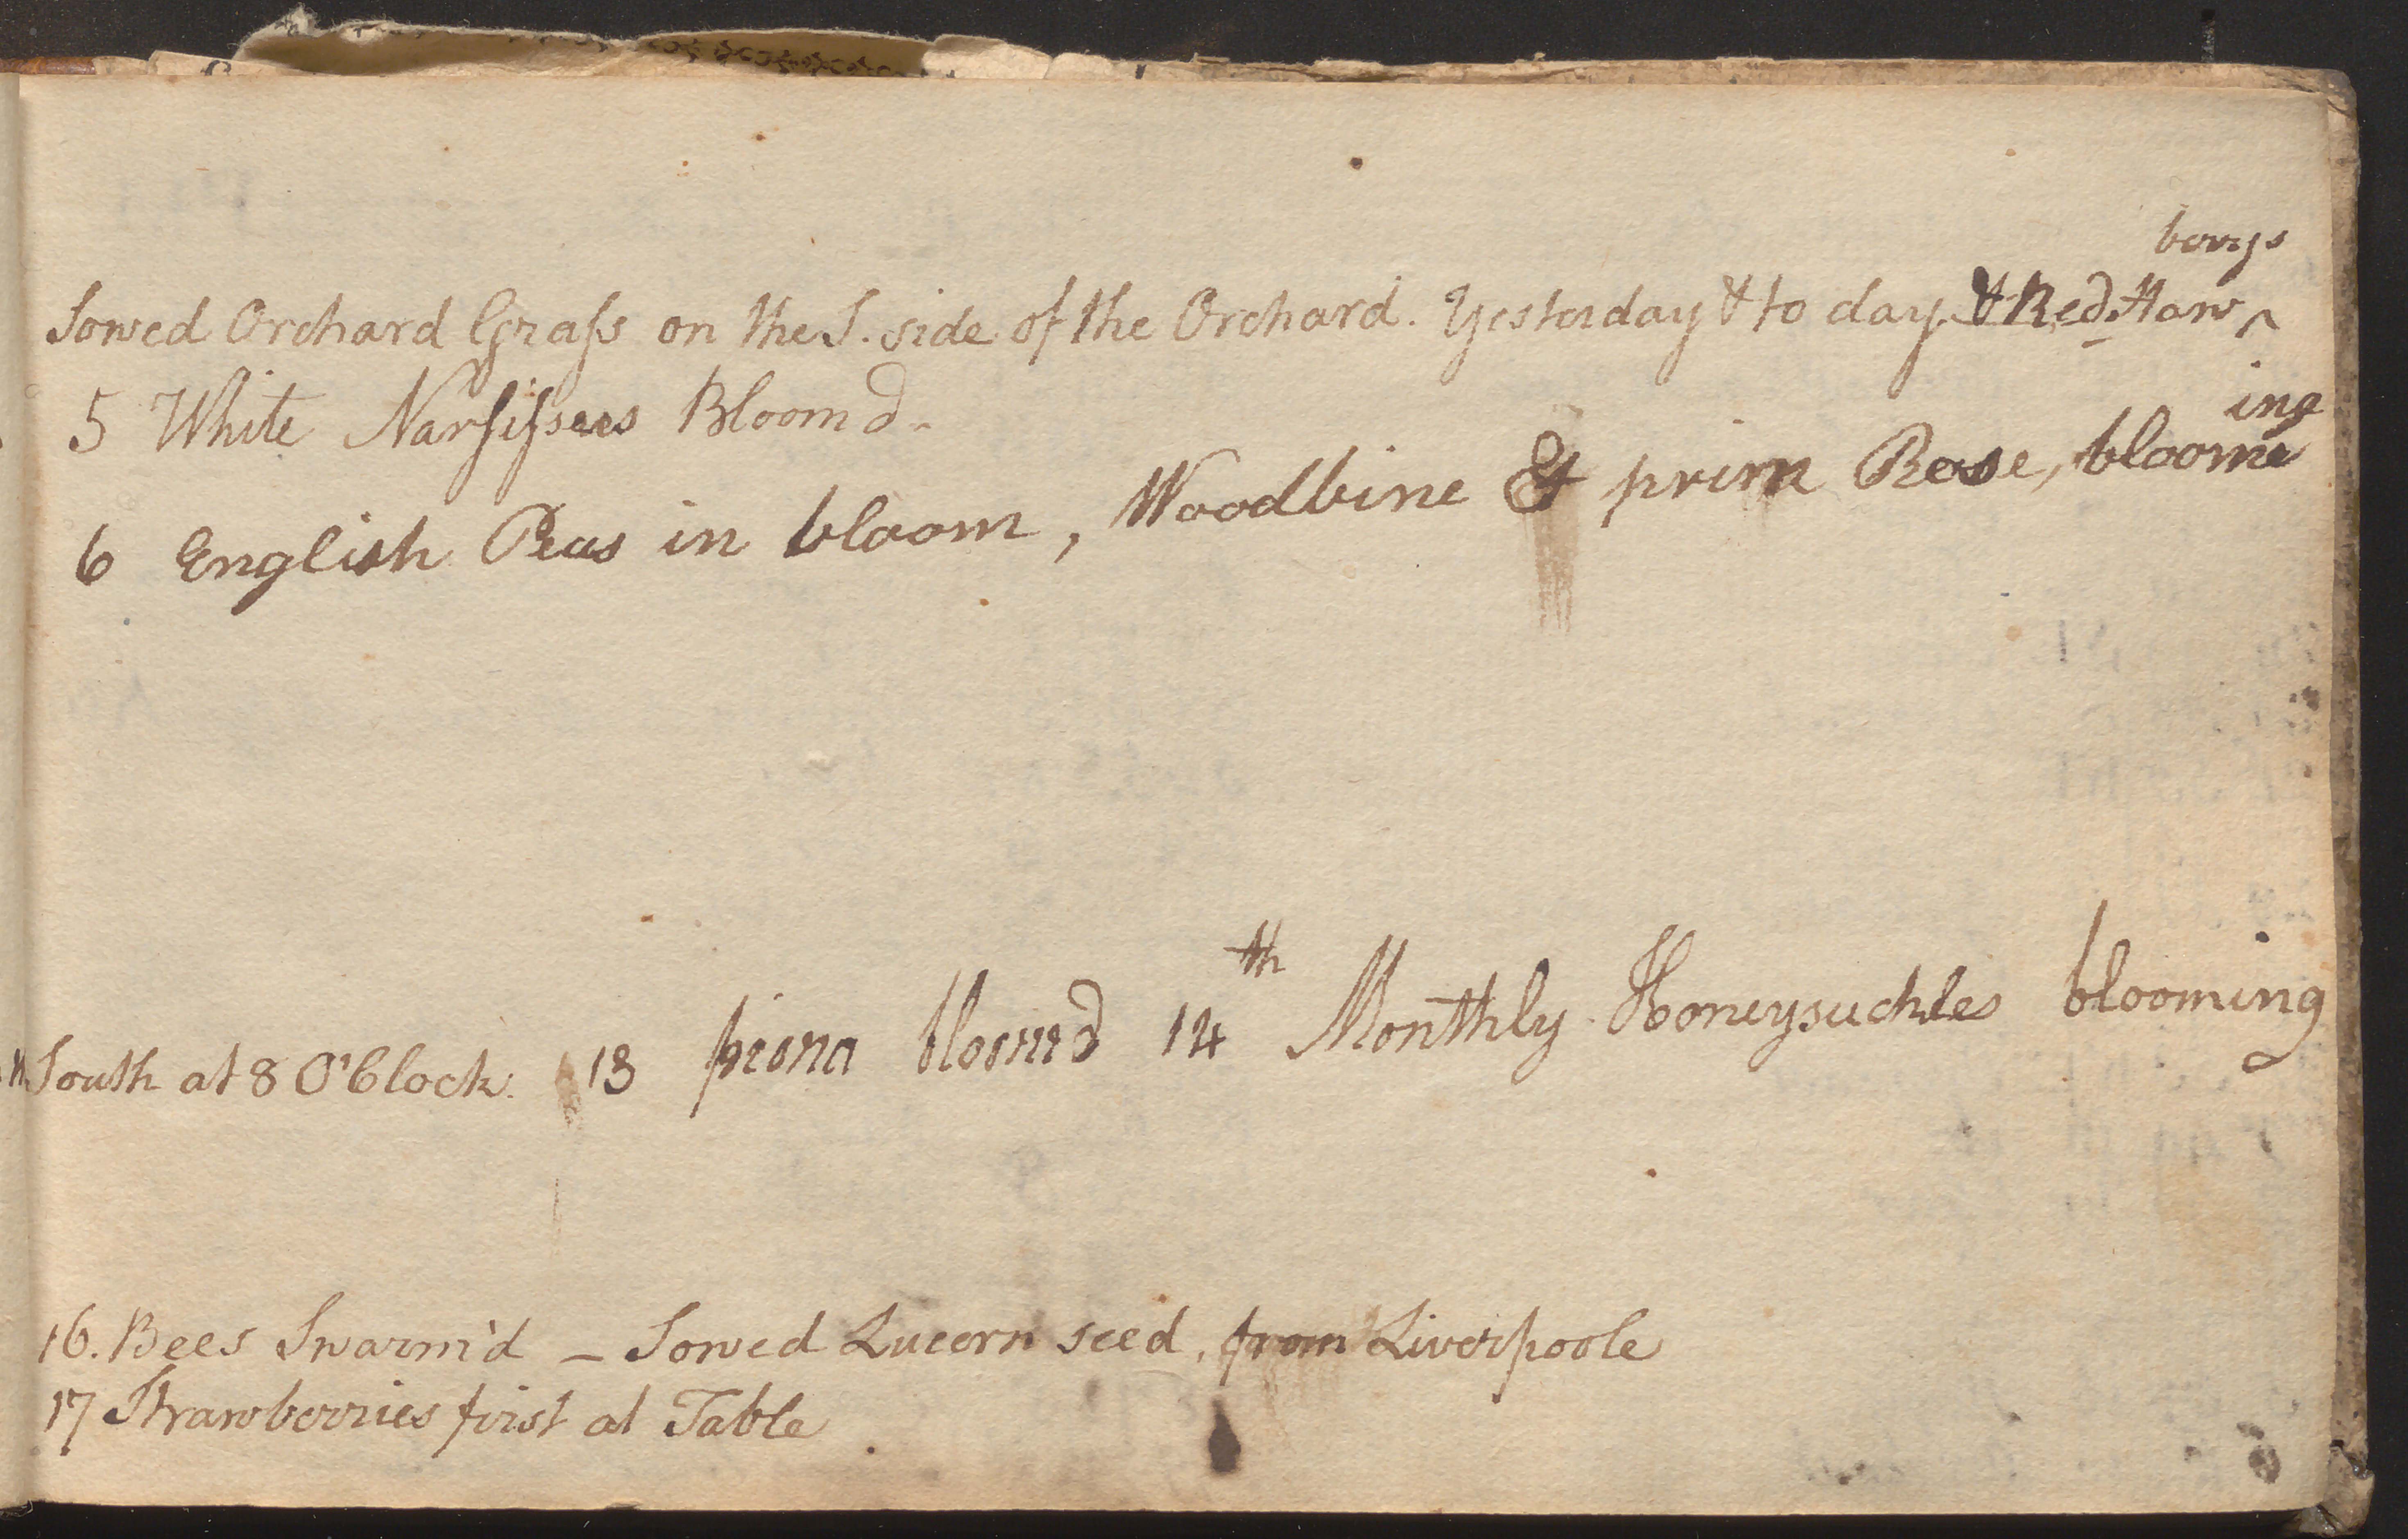
Farther along in the project, I needed to make small, but potentially impactful decisions when I organized and cleaned the data. I have learned that tidy data usually refers to (among other things) one piece of information per datapoint, or in this case, per spreadsheet square. How could I do this if I am using a dataset that could be interpreted in different ways? For example, Madison wrote down observations from his garden throughout the records, in which he noted which plants were sowed, when they bloomed, and when they were harvested. While we incorporated columns “Planting,” “Blooming,” and “Harvest,” some of Madison’s notes were ambiguous. On May 6, 1789, Madison wrote “English peas in bloom.” Did that note mean I should mark off the column “Leafing” as well as “Blooming”? When peas were grafted, did that count as planting, or something else? I needed to make decisions based on what was understandable to me, as a scholar and non-agriculturalist, but also note the information that best represented what Madison may have meant when we took these notes generations ago. All of these decisions were meticulously noted in our documentation to make sure that any researcher could see why we made those choices. I have learned that the methods and documentation of a dataset can sometimes be equally significant, or more so, to the data itself if I use an open datasource.
Over eight thousand data entries later and hours spent confirming transcriptions and weather interpretations, the dataset for Madison’s first two volumes is complete. Now it can be used alongside Thomas Jefferson’s meteorological database, or on its own. Either way, we have it compiled so that researchers can get as much unique, important information out of the datasheet without getting blindsided by any decisions we made to best translate Madison’s data from manuscript to spreadsheet.
Want to learn more? Check out Molly's digital exhibit, "Locating the Transatlantic Seed Trade in James Madison’s Garden," part of the Historic Meteorological Project at APS.
 This project has been made possible in part by a major grant from the National Endowment for the Humanities: Coronavirus Aid, Relief, and Economic Security Act.
Any views, findings, conclusions, or recommendations expressed in this blog do not necessarily represent those of the National Endowment for the Humanities.