Weather affects our everyday lives. That sentiment may sound familiar for two reasons: 1.) It’s true and 2.) These were the starting words of my blog in October 2021 on the pilot phase of the APS Community Science Weather Data Project (CSWDP). The American Philosophical Society partnered with Bodine High School and Newtown Middle School in a year-long project to collect weather data in their communities in the Fall 2021 to Spring 2022 school year.
Throughout this time period, we collected over 2000 responses from the students. Students collected temperature with a thermometer, air pressure with a barometer, wind speed with a digital anemometer, noted general weather, and made observations. The data was collected in the morning and afternoon, when it was at its coldest and warmest temperatures. Data was collected Monday-Friday excluding holidays, snow days, test days, etc. APS educators would meet with the classes once a month (depending on class schedules) for check-ins and occasional activities. Some of these activities included: observation and inference games and talks about standardization and transcribing. Each check-in went over the students’ data, observations they made, and possible small ways for improvements.
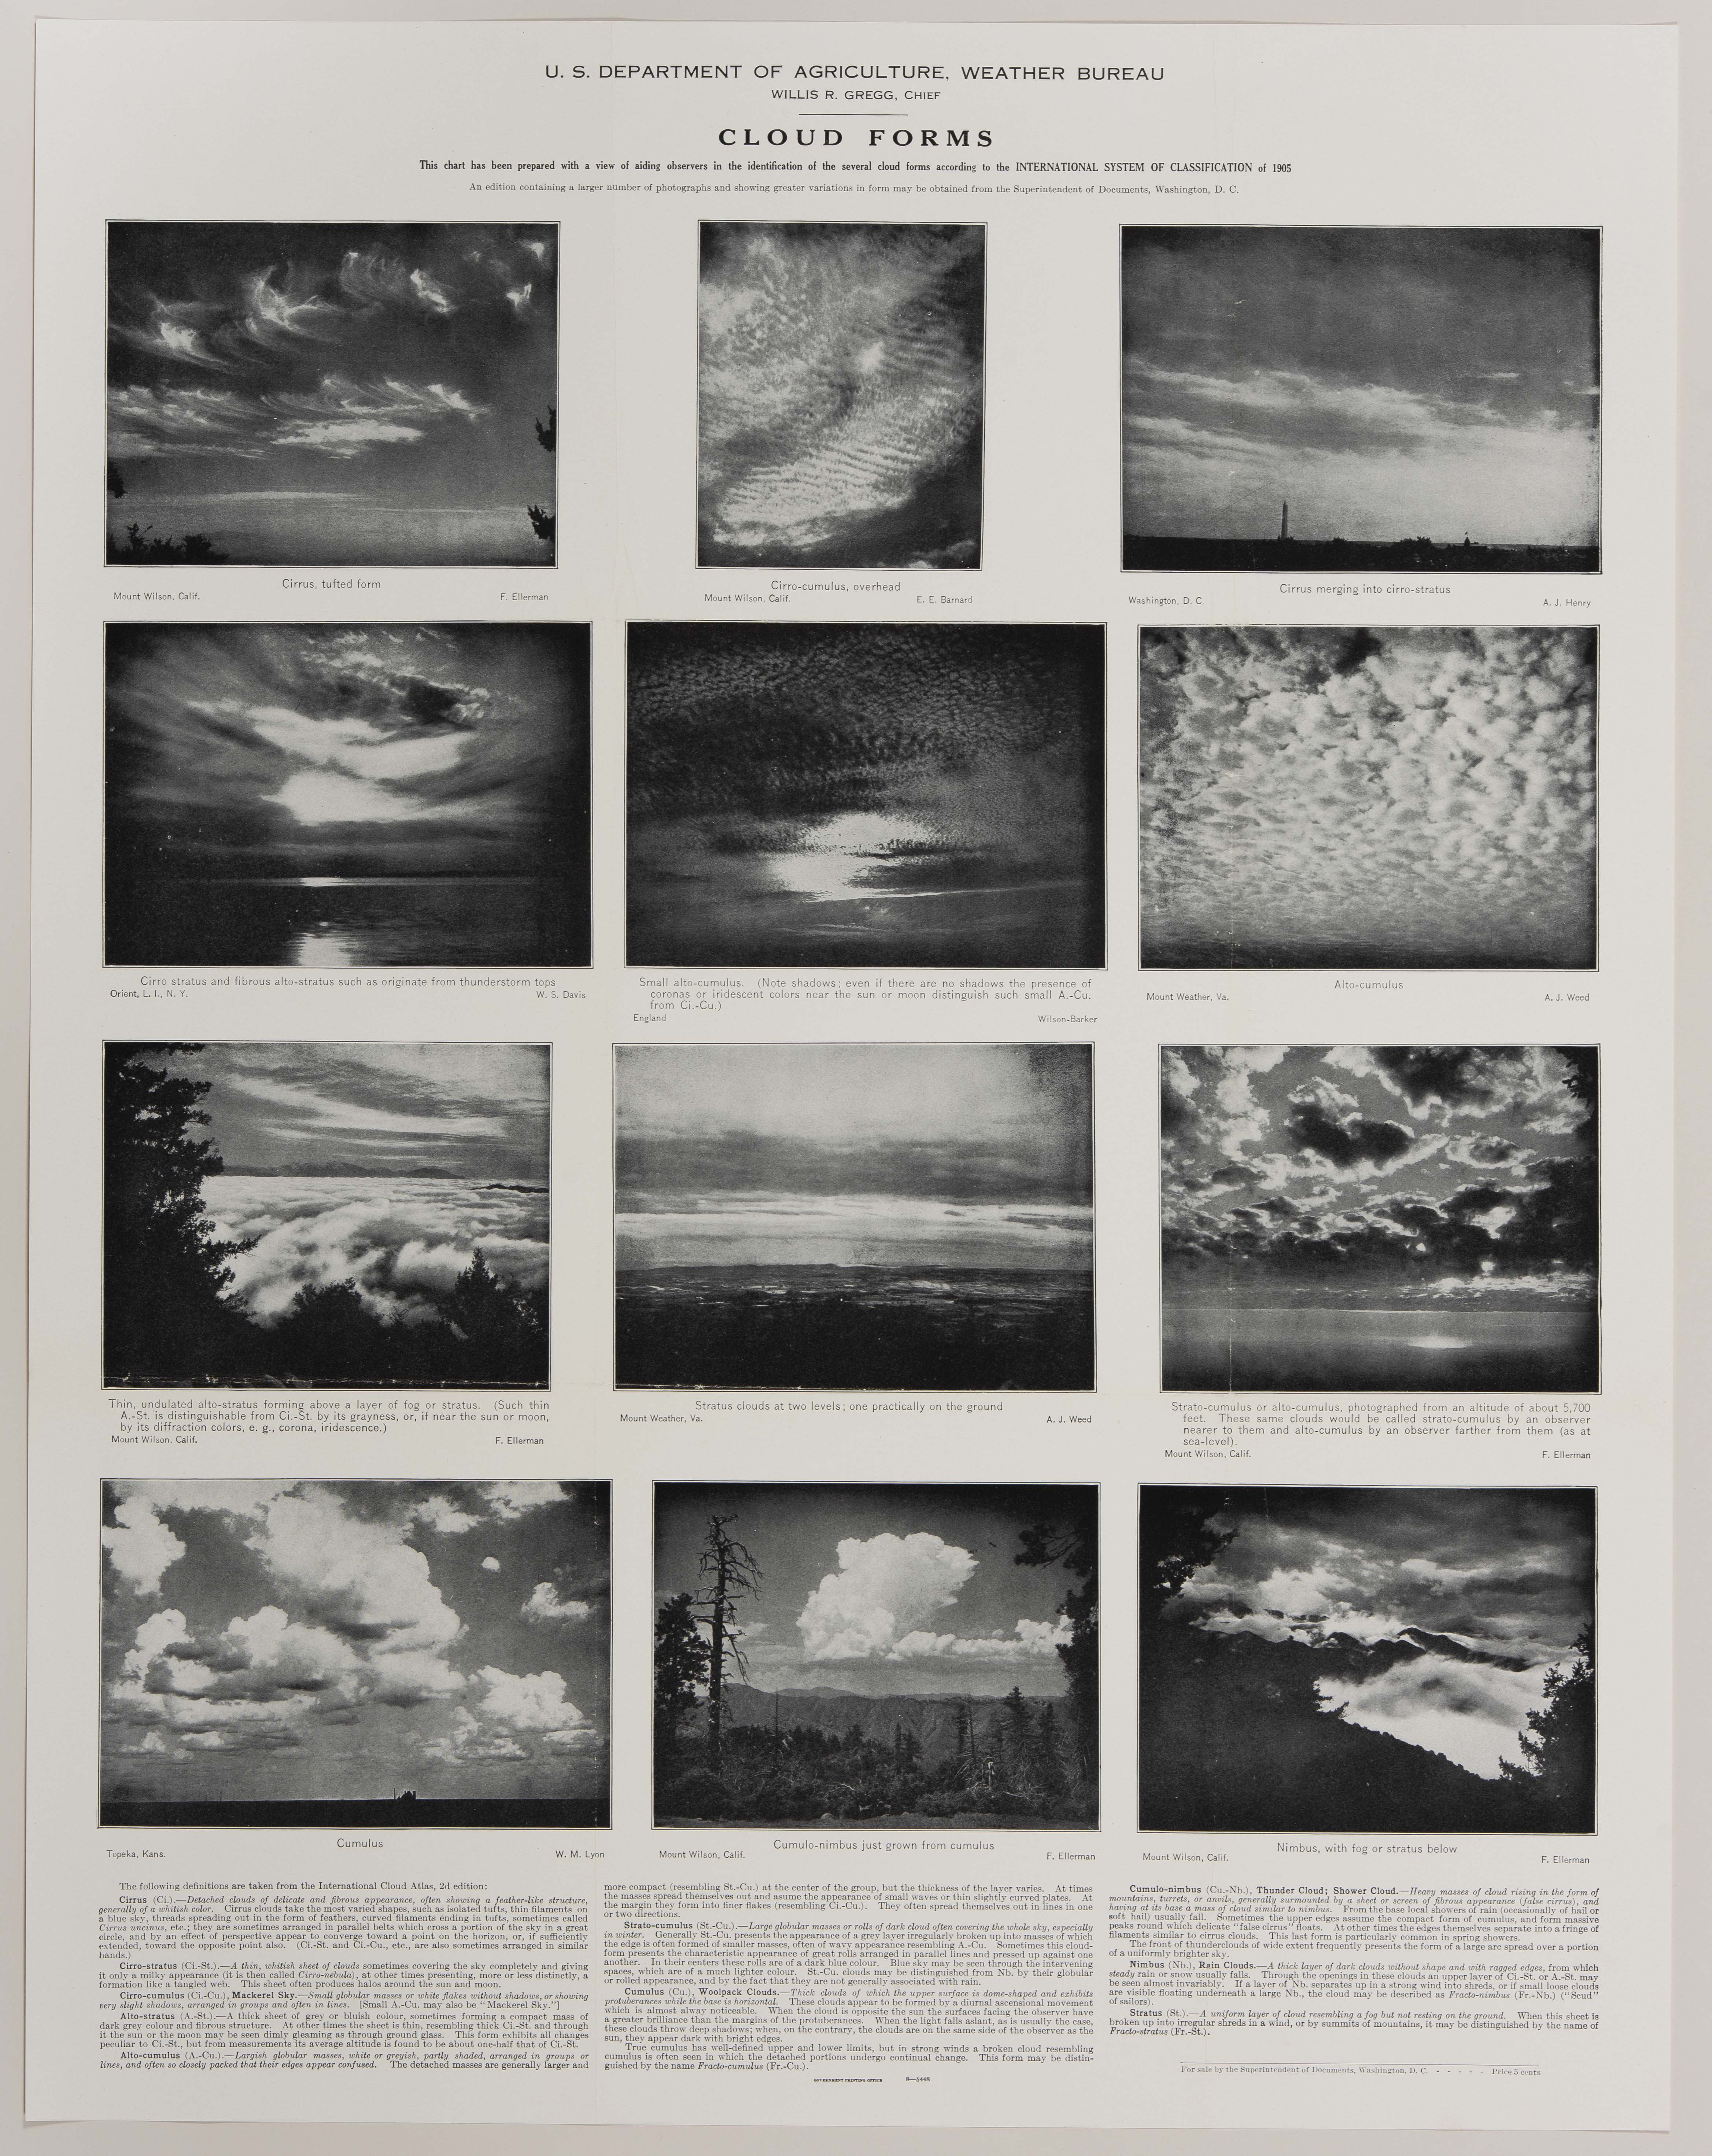
One of the ideas reinforced in one of the check-ins was that standardization is essential. Standardization enables people to communicate scientific data efficiently and clearly to a large audience. During one of the student check-ins, APS educators showed the above Cloud Forms chart by Willis R. Gregg. We see clouds everyday and can use basic descriptions to help identify them. For example, wispy kinds of clouds are known as cirrus clouds, and they usually denote nice weather. If you see cauliflower shaped clouds forming vertically, then you should probably seek shelter as these usually forewarn a thunderstorm or bad weather. Using charts like these help everyday people identify what cloud they’re seeing and also what kind of weather might be blowing in.
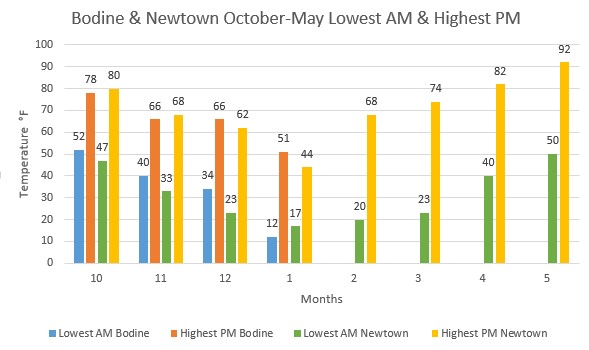
APS educators also engaged with students about the data they collected. See below for some highs and lows from the 2021-2022 school year from both Bodine and Newtown. Below is a chart of the schools lowest recorded morning temperature and highest recorded afternoon temperatures. There were some surprising warm days in October and November of 2021. This sounds very familiar with our recent high temperatures in October and November of 2022, when it hit the 70s during the second week of November. We’ll have to wait further into December to see if this warmer trend continues like last year.
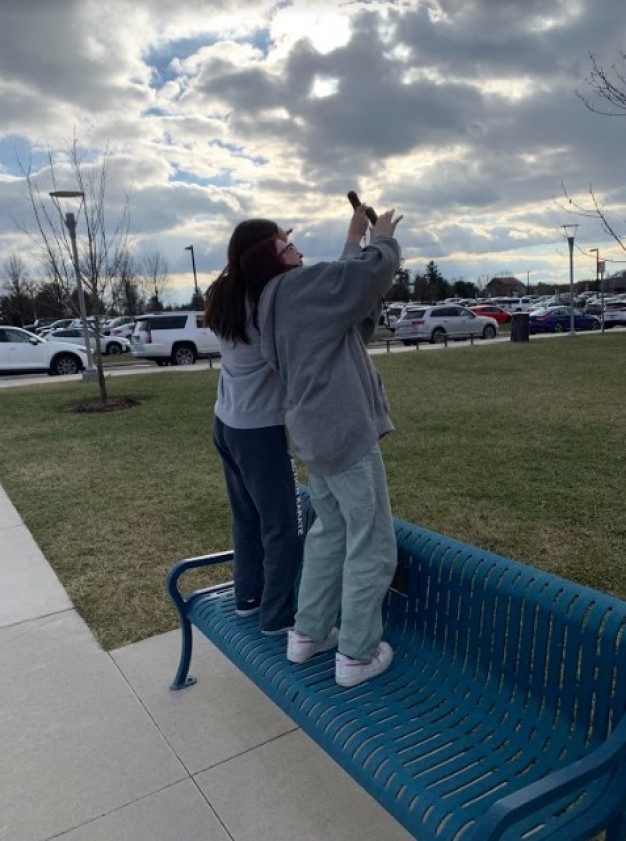
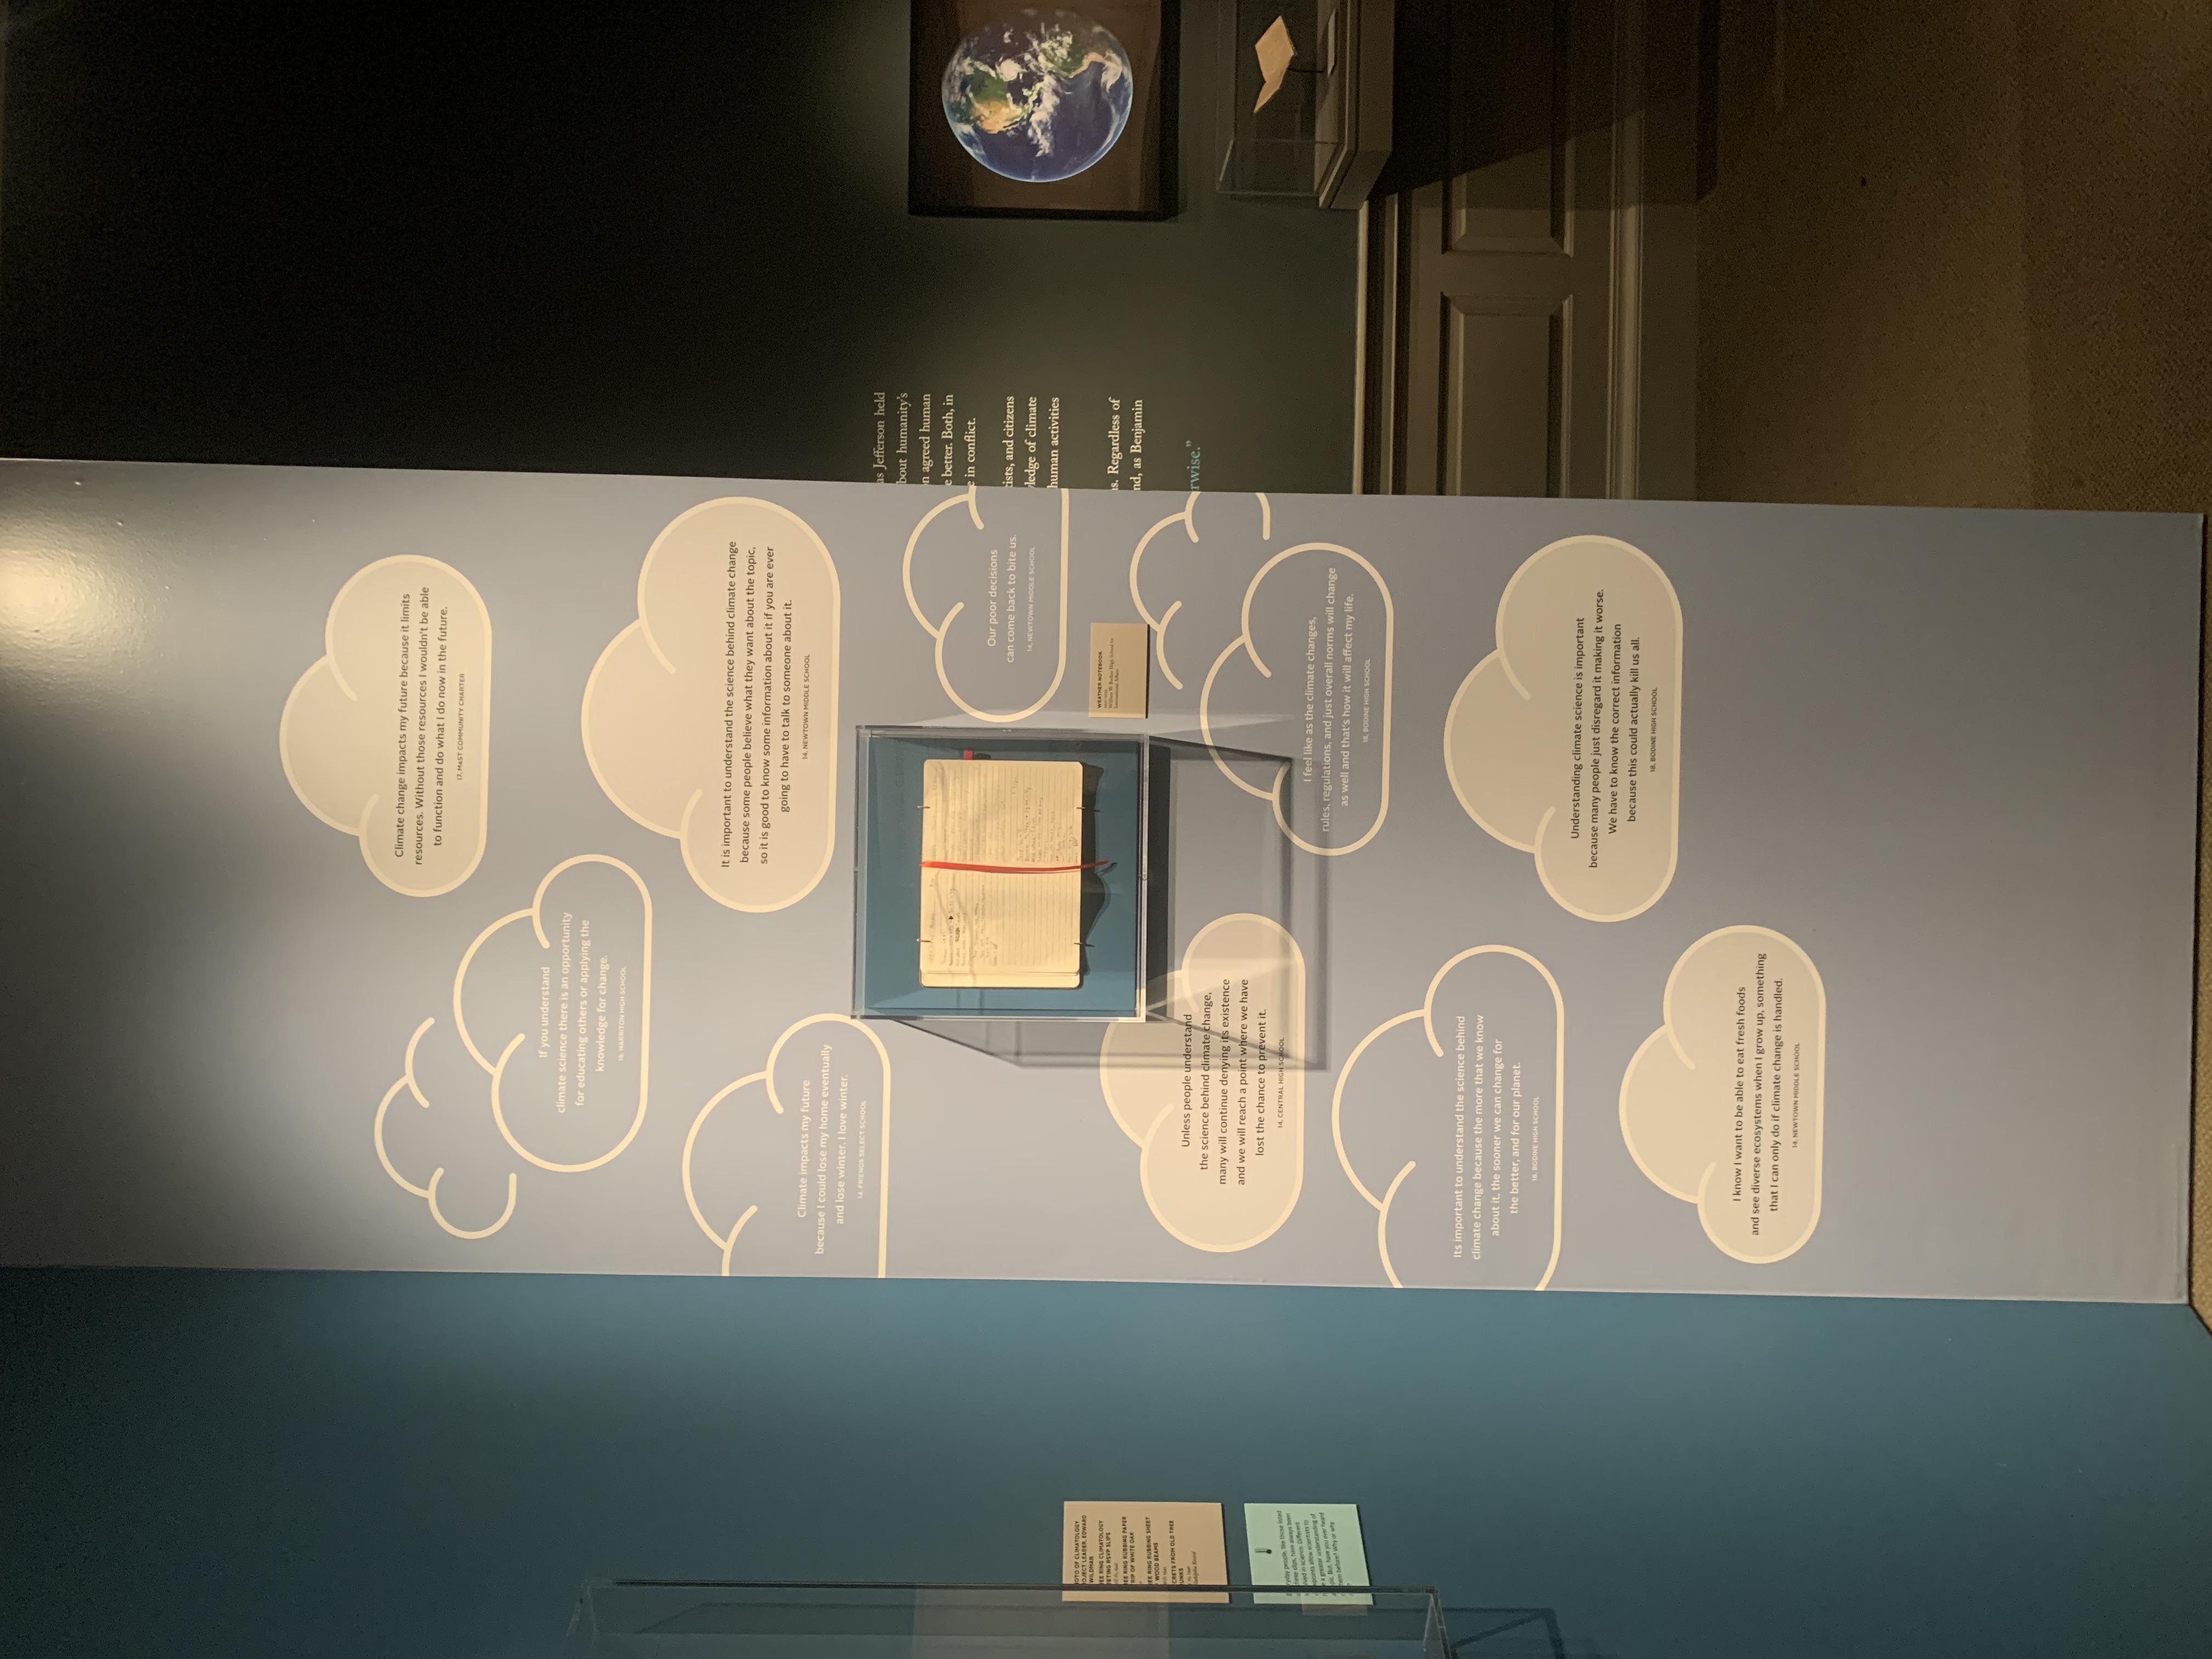
APS educators were guided by both student check-ins and their data to create various educational engagements in the Becoming Weatherwise exhibition. Through one of these engagements, we were able to display a student’s weather data notebooks. Looking at the photo below, you will see we also had quotes from other local students (including those from Bodine and Newtown) surrounding the notebook talking about their ideas on climate science. A prevalent theme in the quotes is that climate science and climate change is not something in the past, it's a now and future problem that students are concerned about.
Stay tuned next year when we add lesson plans on the projects’ main online page surrounding the topics covered during the Community Science Weather Data Project. Of course, if you haven’t already, visit the Becoming Weatherwise exhibition, which runs until the end of December and see some of the students’ work in person!